
Paisley
Insights
a Fractional
CMO Blog
At Paisley Analytics, we believe that the most successful marketing is a science, not a shot in the dark. It's about being so deeply "tuned in" to your customers and market that you can see exactly where the opportunity lies. Here, we unravel the intricate patterns hidden within data and translate them into clear, actionable insights for your business. We'll explore how to build a growth strategy that replaces guesswork with certainty, confusion with clarity, and wasted spending with measurable results.
Welcome to the conversation. We're listening.

Your Old Customer Personas Are Obsolete:
What the 2025 Hilton Trends Report Reveals About Today's "Maximized" Consumer
The 2025 Hilton Trends Report has just been released, and while it's framed around travel, its findings are a critical wake-up call for every business. The report identifies a new consumer mindset: the "Travel Maximizer" - a person who is more discerning, experience-driven, and specific in their demands than ever before.
For us at Paisley Analytics, this report is a goldmine. It provides clear, data-backed evidence that traditional, one-dimensional customer personas are no longer effective. The modern consumer is a complex, often contradictory, collection of "in-the-moment" intentions.
If your business is still segmenting by simple age and location, you're falling behind. Here are our key takeaways on what this new consumer landscape means for your data strategy.
1. The Rise of "Intent-Driven" Personas
The most significant shift is the move from demographic segments to psychographic and intent-driven segments. The report outlines several new personas that have little to do with age and everything to do with purpose:
- Gen Alpha: Don't market to the parents; market through them. This new generation is directly influencing purchasing, with 70% of parents who travel with kids picking the destination based on their children's needs and interests. Furthermore, 56% of families will choose a hotel specifically for its kids' club or youth programming.
- "MeMooners" (Solo Travelers): This is not a niche segment. The report found that nearly half (47%) of global respondents often travel by themselves. Their needs are unique, prioritizing safety-focused amenities , flexible dining (like smaller portions), and pet-friendliness. In fact, Hilton.com searches for pet-friendly options doubled year-over-year.
- "Frolleagues" (Friends + Colleagues): The line between work and leisure has permanently blurred. One in four business travelers expects team building to be their reason for traveling next year. A quarter of global respondents plan "bleisure" trips (combining business and leisure) , and 29% often travel with colleagues for fun.
The Paisley Insight: Your data must go deeper. Are you tracking why a customer is interacting with you? Is it for family, for solo relaxation, or for a blend of work and play? The same customer can be all three at different times.
2. The "Vacation vs. Traveling" Paradox
One of the most fascinating findings is the split in consumer motivation. The report shows two seemingly contradictory goals:
- The "Vacationer" (Wants to Relax): This group is focused on recharging. 78% of global travelers aim to be spontaneous on vacation , 60% enjoy lounging all day , and more than half (50%) prefer not to even leave the hotel for their entire stay.
- The "Traveler" (Wants to Explore): This group is driven by a fear of missing out (FOMO). 67% of travelers like to have a daily agenda for their trip , and they are focused on exploring new environments and cultures.
The Paisley Insight: This isn't a contradiction, instead it's a clear signal for hyper-segmentation. A one-size-fits-all experience will fail both of these customers. Businesses must use behavioral data to determine if a customer is in a "recharge" mindset or an "explore" mindset and tailor the experience accordingly.
3. The Tech Paradox: Seamless Tech to Enable a Digital Detox
Consumers have a new, complex relationship with technology. They demand it for convenience but are simultaneously trying to escape its grip.
- Demand for High-Tech: Friction is the enemy. 63% of travelers want to use a digital room key. On Hilton.com, "Streaming TV" is one of the top 10 search filters that converts searches to stays.
- Desire for Digital Detox: The number one reason people travel is for rest and relaxation. As a result, 24% of global travelers admit they power down and turn off social media on vacation more than they used to , and 20% actively avoid the news.
The Paisley Insight: The new role of technology is to be invisible. The goal isn't more apps; it's less friction. Data-driven tech should work in the background (like a digital key ) to make the experience so seamless that the customer can disconnect.
What This Means for Your Business
The "Travel Maximizer" is a proxy for the "Customer Maximizer." Today's consumers expect you to know why they're there, not just who they are.
They are traveling for "Sleep Tourizzzm" , "Time Travel" (nostalgia-driven trips) , and culinary experiences (dining is the #2 travel budget priority).
The old methods of analysis can't keep up with these fluid, intent-driven needs. The only way to win is to harness your data to understand the "why" behind every click, purchase, and interaction.
At Paisley Analytics, we help businesses uncover these complex customer stories. We turn trend reports like this into actionable strategies, allowing you to move beyond obsolete personas and engage with your customers as they truly are.

Beyond the Hype: OpenAI's Latest Research Reveals How 700 Million People Actually Use ChatGPT
A deep dive into the data and what it means for your marketing, product, and customer engagement strategies.
The world has watched ChatGPT's meteoric rise, but until now, much of the conversation around its use has been based on anecdotes and speculation. A landmark study published on September 15, 2025, by researchers from OpenAI, Harvard, and Duke universities finally pulls back the curtain. By analyzing a massive, representative sample of conversations, the paper, titled "How People Use ChatGPT," provides an unprecedented look into user behavior on a global scale.
By July 2025, the platform had amassed over 700 million weekly active users—roughly 10% of the world's adult population. For marketing startups, small businesses, and hospitality companies, this data isn't just interesting; it's a strategic roadmap. It tells us what people want, how they think, and where they are looking for help. Here at Paisley Analytics, we've distilled the key findings and translated them into actionable insights for your business. While the research is based on usage for ChatGPT, it likely applies to most LLM's and what many refer to as "AI."
The Big Picture: Key Takeaways from the Research
First, let's look at the high-level trends that are reshaping the digital landscape.
- The Non-Work Revolution: While many analyses focus on workplace productivity, the data shows that personal use dominates. Non-work-related messages have surged from 53% to over 70% of all usage in just one year. This is a massive, engaged consumer audience seeking help with their daily lives.
- The "Big Three" Use Cases: Nearly 80% of all ChatGPT conversations fall into three main categories: Practical Guidance (like tutoring and how-to advice), Seeking Information (a direct substitute for web search), and Writing (including drafting, editing, and summarizing).
- Decision Support is King: The researchers introduced a powerful framework for user intent: Asking, Doing, or Expressing. "Asking"—using the chatbot for advice and information to make better decisions—is the largest (49%) and fastest-growing category. People use ChatGPT not just to create, but to help them think.
- A Mainstream, Global Audience: The early adopter profile of a disproportionately male user base has vanished. The gender gap has closed, with users having typically feminine names becoming slightly more common as of June 2025. Furthermore, usage has grown fastest in low- and middle-income countries, and nearly half of all messages from adults come from users under the age of 26.
Actionable Insights for Your Business
Understanding how and why people use ChatGPT allows you to align your strategy with actual user behavior.
For Marketing New Startups & Existing Small Businesses
Your potential customers are on ChatGPT, actively looking for solutions. This data shows you how to meet them there.
Re-Calibrate Your Content Strategy Around the "Big Three":
- Practical Guidance: Your content marketing should be overwhelmingly helpful. Create downloadable guides, step-by-step tutorials, and actionable advice that directly addresses "how-to" queries. If you sell project management software, your content should be "How to plan a project from scratch."
- Seeking Information: This is the new SEO. Users are asking ChatGPT for specific information about products, events, and facts. Ensure your business's data is structured and easily accessible online so that AI models can find and recommend you as the answer.
- Writing Assistance: Writing is the single most common work-related task, accounting for 40% of professional use. If your product helps with communication, reporting, or content creation, your marketing should explicitly target these pain points. The study notes that two-thirds of these requests involve modifying existing text, not creating new text from scratch.
Target the "Asking" Intent: Your audience uses AI for decision support. Frame your product not just as a tool that does something, but as a co-pilot that helps users decide something. Marketing copy should focus on benefits like "Make smarter financial decisions," "Choose the perfect solutions for ____," or "Plan your strategy with confidence." Website FAQ's that mimic potential prompt questions increase relevance toward guiding AI/LLM's to your content as a potential answer.
For the Hospitality Industry (Hotels, Restaurants, Travel)
The travel and hospitality sectors are built on planning, guidance, and information-seeking—a perfect match for ChatGPT's primary use cases.
- Become the Go-To Source for "Practical Guidance": Travelers and diners are natural "askers." They seek how-to advice, creative ideas, and tutoring.
- Actionable Idea: Develop content for your blog and social media that functions as a travel guide. Create "The Perfect 3-Day Itinerary in [Your City]," "How to Navigate Public Transit Like a Local," or "Creative Date Night Ideas Near Our Restaurant." This content is precisely what users are asking AI for.
- Optimize for Informational Searches: Users are looking for recipes, product information, and specific facts.
Actionable Idea: A user asking, "Find a hotel in Houston with a rooftop pool and good reviews" is in the final stages of decision-making. Ensure your online presence is impeccable. Your website, Google Business Profile, and listings on travel sites must have accurate, detailed, and structured data about your amenities, hours, menu, and unique selling points. This is the information AI models will use to answer queries and make recommendations. (BTW, we can help)
Lean into Creative Ideation: A key part of "Practical Guidance" is creative ideation. Your customers are looking for inspiration.
Actionable Idea: Market your venue by targeting these queries. A hotel could run a campaign around "Plan your dream wedding with AI" or "Unique ideas for a family reunion." A restaurant can create content around "What to cook for a special anniversary" that features a signature dish recipe. While the answer provided may guide a user toward making their own dinner, the authority of your establishment as being the source for AI/LLM response makes a great impression for future meals out of the home.
The Bottom Line
The OpenAI study reveals that ChatGPT has evolved far beyond a simple tool for tech enthusiasts. It is a global, mainstream utility for thinking, planning, and living. The dominant use cases are not coding or complex technical tasks, but the universal human needs for guidance, information, and communication. In many ways access to ubiquitous AI/LLM platforms is replacing Search. By modifying your company's content to accommodate how AI/LLM's search for information, you have the opportunity to increase your brand's relevance for an increasing global audience.
For businesses, the message is clear: the modern customer journey often involves a conversation with an AI. By understanding the nature of these conversations, you can ensure your brand is part of the discussion, provides real value, and becomes the solution they were asking for all along.
Uncorking Potential:
From Macro Trends to Micro Opportunities: A Data-Driven Guide for Houston's Restaurant Owners
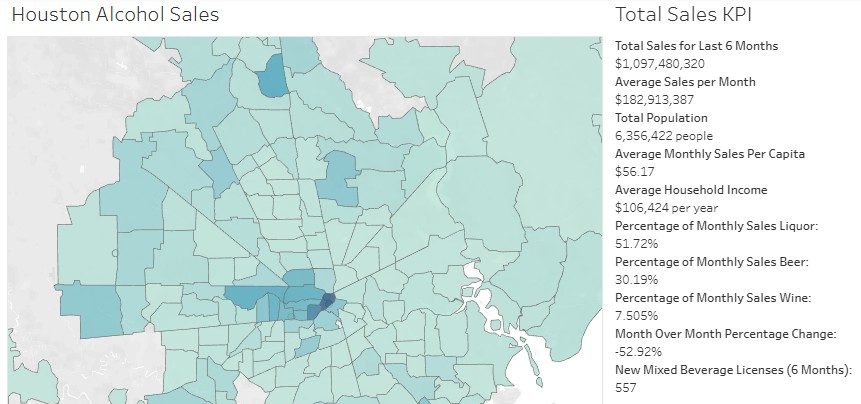
To provide a clear, actionable view of the Houston market, Paisley Analytics integrated three distinct data sources:
TABC Tax Receipts: To get a granular, real-world measure of consumer spending on discretionary items like alcohol, which serves as a powerful proxy for overall dining and entertainment activity. (TABC)
U.S. Census Bureau Data: To build a rich demographic "fingerprint" for each zip code, including average household income, population density, and educational attainment. (U.S. Census Bureau, 2025)
The Greater Houston Partnership (GHP) Macro-Economic Update: To layer in a high-level understanding of city-wide trends in employment, spending, and population shifts. (GHP, 2025)
By synthesizing this information, we created an interactive dashboard that highlights trends and demographics by zip code across Houston. The following analysis is a narrative drawn from that powerful tool, designed to help you navigate the current market and identify specific, data-backed growth opportunities.
The Big Picture: A Houston Market in Transition
The latest economic data from the Greater Houston Partnership paints a picture of a city experiencing cautious but resilient growth. While the overall economy is expanding, uncertainty and rising costs have led businesses to be more careful. This creates a mixed but opportunistic landscape for the restaurant industry. (GHP)
Key Macro Trends Affecting Your Business:
- Robust Consumer Spending: Despite some business caution, local sales and use tax collections are up 3.9% year-to-date. This is a critical signal that Houstonians are still actively spending money, especially on discretionary items like dining and entertainment. (GHP)
- A Shifting Population: Home sales are up 4.2% and apartment occupancy is up 1.1% compared to last year. This indicates that people are on the move, establishing new households and creating new pockets of demand across the metro area. These new residents are actively looking for their "go-to" local spots. (GHP)
- Sector-Specific Softness: Tepid hiring in professional services (down 1.1% year-over-year) and a downturn in construction contracts (down 25.1%) might impact lunch traffic from office workers and construction crews in certain business districts. (GHP)
This economic environment means that success hinges on precision. You must understand not only that people are spending, but where they are spending, who is spending, and what they are buying.
A Zip Code Deep Dive: Uncovering Houston's Dining Hotspots
The following analysis identifies the top establishments for aggregate alcohol sales, as well as the top vendor for each specific beverage category, based on the latest available data. This report focuses exclusively on licensed restaurants and bars, filtering out grocery stores and large-scale food service providers to provide a true measure of the local dining scene.
High-Volume & High-Value Zip Codes
These established areas represent the core of Houston's dining economy, demonstrating consistent high performance in the latest monthly sales data.
77002 (Downtown/Midtown)
- Demographics: Pop: 18,800 | Avg. Income: $110,669 | Education (Bach+): 33.3% | Sales/Capita: $108/mo
- Zip Code Drink Profile: 52.5% Liquor | 12.1% Wine | 35.4% Beer
Top Overall & Beer Vendor: POST Houston
- Previous Month Sales: $4,213,296 | Trend Data: N/A in source file
- Vendor Sales Mix: 42.6% Liquor | 9.1% Wine | 48.3% Beer
Top Liquor Vendor: POST Houston
- (See above)
Top Wine Vendor: Vic & Anthony's Steakhouse
- Previous Month Sales: $547,895 | MoM Trend: +11.2% | 6-Mo Trend: -4.7%
- Vendor Sales Mix: 35.2% Liquor | 62.5% Wine | 2.3% Beer
77006 (Montrose)
- Demographics: Pop: 37,227 | Avg. Income: $153,991 | Education (Bach+): 76.1% | Sales/Capita: $131/mo
- Zip Code Drink Profile: 69.2% Liquor | 17.7% Wine | 13.1% Beer
Top Overall & Wine Vendor: Uchi
- Previous Month Sales: $312,581 | MoM Trend: +9.5% | 6-Mo Trend: +15.2%
- Vendor Sales Mix: 48.9% Liquor | 33.5% Wine | 17.6% Beer
Top Liquor Vendor: Anvil Bar & Refuge
- Previous Month Sales: $188,743 | MoM Trend: +8.9% | 6-Mo Trend: +22.7%
- Vendor Sales Mix: 95.1% Liquor | 2.0% Wine | 2.9% Beer
Top Beer Vendor: Uchi
- (See above)
77024 (Memorial Villages)
- Demographics: Pop: 47,422 | Avg. Income: $253,422 | Education (Bach+): 78.0% | Sales/Capita: $65/mo
- Zip Code Drink Profile: 56.3% Liquor | 30.6% Wine | 13.1% Beer
Top Overall, Liquor & Beer Vendor: The Houstonian Hotel
- Previous Month Sales: $2,311,268 | Trend Data: N/A in source file
- Vendor Sales Mix: 55.3% Liquor | 32.1% Wine | 12.6% Beer
Top Wine Vendor: The Capital Grille
- Previous Month Sales: $721,118 | Trend Data: N/A in source file
- Vendor Sales Mix: 30.1% Liquor | 68.2% Wine | 1.7% Beer
77007 (The Heights)
- Demographics: Pop: 44,551 | Avg. Income: $183,994 | Education (Bach+): 74.8% | Sales/Capita: $67/mo
- Zip Code Drink Profile: 60.8% Liquor | 20.7% Wine | 18.5% Beer
Top Overall & Liquor Vendor: Permission Whiskey & Service Co.
- Previous Month Sales: $255,098 | Trend Data: N/A in source file
- Vendor Sales Mix: 92.8% Liquor | 4.9% Wine | 2.3% Beer
Top Wine Vendor: Coltivare Pizza & Garden
- Previous Month Sales: $65,920 | Trend Data: N/A in source file
- Vendor Sales Mix: 28.9% Liquor | 55.8% Wine | 15.3% Beer
Top Beer Vendor: Heights Bier Garten
- Previous Month Sales: $12,601 | Trend Data: N/A in source file
- Vendor Sales Mix: 15.7% Liquor | 4.1% Wine | 80.2% Beer
High-Growth "Hotspot" Zip Codes
These areas show significant activity, indicating strong local demand and emerging leaders.
77014 (Northwest Houston/Greenspoint)
- Demographics: Pop: 36,314 | Avg. Income: $69,471 | Education (Bach+): 14.8% | Sales/Capita: $3/mo
- Zip Code Drink Profile: 32.4% Liquor | 0.2% Wine | 67.4% Beer
Top Overall, Liquor & Beer Vendor: Bombshells Restaurant & Bar
- Previous Month Sales: $185,330 | MoM Trend: +21.5% | 6-Mo Trend: +35.1%
- Vendor Sales Mix: 45.1% Liquor | 1.2% Wine | 53.7% Beer
Top Wine Vendor: Northgate Country Club
- Previous Month Sales: $28,883 | MoM Trend: +15.3% | 6-Mo Trend: -5.9%
- Vendor Sales Mix: 51.2% Liquor | 33.1% Wine | 15.7% Beer
77094 (Katy/Energy Corridor)
- Demographics: Pop: 35,896 | Avg. Income: $188,141 | Education (Bach+): 69.3% | Sales/Capita: $19/mo
- Zip Code Drink Profile: 58.7% Liquor | 19.3% Wine | 22.0% Beer
Top Growth Vendor: Pluckers Wing Bar
- Previous Month Sales: $104,202 | MoM Trend: +81,307% (New Opening) | 6-Mo Trend: N/A
- Vendor Sales Mix: 48.2% Liquor | 2.1% Wine | 49.7% Beer
Top Liquor Vendor: Local Table
- Previous Month Sales: $42,670 | MoM Trend: +19.3% | 6-Mo Trend: +1.2%
- Vendor Sales Mix: 45.3% Liquor | 33.9% Wine | 20.8% Beer
Top Wine Vendor: Astor Farm to Table
- Previous Month Sales: $18,456 | MoM Trend: +11.3% | 6-Mo Trend: -2.8%
- Vendor Sales Mix: 31.5% Liquor | 55.1% Wine | 13.4% Beer
77095 (Cypress/Copperfield)
- Demographics: Pop: 95,210 | Avg. Income: $116,217 | Education (Bach+): 42.6% | Sales/Capita: $19/mo
- Zip Code Drink Profile: 61.3% Liquor | 10.6% Wine | 28.1% Beer
Top Growth Vendor: Tradicao Brazilian Steakhouse
- Previous Month Sales: $155,987 | MoM Trend: +115.6% | 6-Mo Trend: +28.9%
- Vendor Sales Mix: 58.1% Liquor | 35.2% Wine | 6.7% Beer
Top Overall & Liquor Vendor: BJ's Restaurant & Brewhouse
- Previous Month Sales: $201,458 | Trend Data: N/A in source file
- Vendor Sales Mix: 35.8% Liquor | 10.1% Wine | 54.1% Beer
Top Wine Vendor: Whiskey Cake Kitchen & Bar
- Previous Month Sales: $51,224 | Trend Data: N/A in source file
- Vendor Sales Mix: 52.1% Liquor | 28.8% Wine | 19.1% Beer
The "New Competition" Battlegrounds
These zip codes have the highest number of new Mixed Beverage (MB) licenses issued in the previous six-month timeframe, signaling intense competition and investment in new full-service bars and restaurants.
1. 77002 (Downtown/Midtown): 28 New MB Licenses
- Demographics: Pop: 18,800 | Avg. Income: $110,669 | Education (Bach+): 33.3% | Sales/Capita: $215/mo
- Zip Code Drink Profile: 52.5% Liquor | 12.1% Wine | 35.4% Beer
2. 77380 (The Woodlands): 24 New MB Licenses
- Demographics: Pop: 44,709 | Avg. Income: $128,155 | Education (Bach+): 60.1% | Sales/Capita: $95/mo
- Zip Code Drink Profile: 58.9% Liquor | 21.2% Wine | 19.9% Beer
3. 77007 (The Heights): 21 New MB Licenses
- Demographics: Pop: 44,551 | Avg. Income: $183,994 | Education (Bach+): 74.8% | Sales/Capita: $67/mo
- Zip Code Drink Profile: 60.8% Liquor | 20.7% Wine | 18.5% Beer
4. 77006 (Montrose): 19 New MB Licenses
- Demographics: Pop: 37,227 | Avg. Income: $153,991 | Education (Bach+): 76.1% | Sales/Capita: $131/mo
- Zip Code Drink Profile: 69.2% Liquor | 17.7% Wine | 13.1% Beer
5. 77024 (Memorial Villages): 17 New MB Licenses
- Demographics: Pop: 47,422 | Avg. Income: $253,422 | Education (Bach+): 78.0% | Sales/Capita: $65/mo
- Zip Code Drink Profile: 56.3% Liquor | 30.6% Wine | 13.1% Beer
Here’s how you can translate this data into actionable strategies:
Tailor Your Strategy to Local Tastes
Instead of guessing what your customers want, use the zip code level data to inform your menu engineering.
- Example: If you own a bar in the 77006 (Montrose) area, you'll notice that liquor accounts for a staggering 69.2% of alcohol sales. This is a clear signal to double down on your cocktail program. You could introduce a new line of premium cocktails, host a "cocktail of the week" promotion, or partner with local distilleries for tasting events. Conversely, in 77014 (Northwest Houston/Greenspoint), where beer dominates at 67.4%, you might focus on expanding your craft beer selection or launching a beer-centric happy hour.
Target the Right Audience with Precision Marketing
Understanding the demographics of your zip code allows you to create marketing campaigns that resonate with the local population.
- Example: In 77024 (Memorial Villages), the average household income is over $250,000, and 78% of residents have a bachelor's degree or higher. A restaurant in this area could create a sophisticated marketing campaign that highlights its premium wine list, chef-driven menu, and upscale ambiance. Marketing channels could include targeted ads on social media platforms that are popular with high-income earners, or partnerships with local luxury apartment complexes and businesses.
Identify and Capitalize on Growth Opportunities
The "High-Growth 'Hotspot' Zip Codes" are areas with burgeoning demand. If you're looking to expand or open a new location, these zip codes represent a prime opportunity.
- Example: A restaurateur looking to open a new concept could see the explosive growth of Pluckers Wing Bar in 77094 (Katy/Energy Corridor) as a sign of a strong market for casual, family-friendly dining. By analyzing the demographics of this area (high income, high education), they could create a concept that appeals to this audience, such as a gastropub with an elevated menu and a family-friendly atmosphere.
Stay Ahead of the Competition
The "New Competition Battlegrounds" data is a crucial indicator of market saturation. Use this information to understand the competitive landscape and differentiate your establishment.
- Example: If you operate in 77002 (Downtown/Midtown), which has seen 28 new mixed beverage licenses in the past six months, you know that competition is fierce. To stand out, you could focus on a niche market, such as a speakeasy-style bar with a unique theme, a restaurant that specializes in a specific type of cuisine not widely available in the area, or by offering an unparalleled customer experience that builds loyalty.
By leveraging the rich data at your fingertips, you can move beyond intuition and make informed decisions that will give you a competitive edge. The Houston restaurant scene is constantly evolving, but with the right data, Paisley Analytics can help not only adapt but thrive in this exciting and ever-changing landscape.
Explore the data for yourself and discover opportunities in your area with our interactive Houston Alcohol Sales Dashboard
Beyond the Plate:
How a Data-Driven Strategy Helped a Houston Restaurant Thrive in a Tough Market
The restaurant industry is a challenging landscape. Even the most brilliant chef-driven concepts face the immense pressure of a fluctuating economy and shifting consumer habits. So, when a client came to us with ambitious goals in a market where many were just trying to stay afloat, we knew a generic marketing plan wouldn't cut it. We needed a strategy as carefully crafted as their signature dishes.
This is the story of how a deep, data-first approach didn't just move the needle, it created remarkable growth in a challenging climate.
Our Recipe for Success: The Paisley Approach
Before a single social media post was drafted or an ad was placed, our first step was to listen and learn. We believe a winning strategy is built on a foundation of genuine understanding, which we gather from every possible angle.
- Aligning with Leadership: Our process began with in-depth discussions with the restaurant's leadership. We sought to understand their vision, their strategic goals, and the specific issues they wanted to improve. What did success look like to them? Where were the operational pain points? This partnership ensures our marketing efforts are directly tied to tangible business objectives.
- A Deep Dive into the Data: We then immersed ourselves in their numbers. We went beyond surface-level sales reports, analyzing menu performance item-by-item to understand what truly resonated with diners. By connecting sales data to specific dishes, we identified signature offerings and opportunities for promotion that would have the greatest impact.
- Understanding the Guest Experience: A restaurant's reputation is built one guest at a time. We meticulously tracked and analyzed online reviews from multiple platforms to distill the core of what customers loved, and what could be improved. To get past the desktop research, we conducted in-person interviews with patrons to gather unfiltered, firsthand feedback on their experience, from the ambiance to the service and the food itself.
This 360-degree discovery phase provided the crucial insights needed to build a bespoke strategy. We weren't just marketing a restaurant; we were amplifying a specific, celebrated experience that we now understood from the inside out.
A Taste of Success: The Results
After implementing the new strategy, the results from the following quarter (Q2 2025) speak for themselves. In a period where the broader industry reported declining traffic and consumer spending, our client achieved significant, measurable growth.
Key Performance Highlights (Year-over-Year):
- Defying Industry Trends: While the restaurant sector faced a slowdown, our client’s Net Sales grew by 3.16%, Total Orders surged by 23.13%, and Total Guests increased by 8.27%.
- Dominating Local Search: Visibility on Google skyrocketed. The restaurant’s Business Profile was viewed 156.2% more times and appeared in 250% more searches. This increased visibility led to more direction requests, menu views, and direct bookings.
Digital Engagement Exploded (vs. Previous 90 Days):
- Facebook: Views skyrocketed by 177.1%, and the restaurant’s reach expanded by 53.4%.
- Instagram: The platform proved to be a visual powerhouse, with views increasing by 58.4% and content interactions growing by 82.4%.
- Website as a Hub: The website successfully attracted 4,745 active users, with the majority being new. Crucially, the main landing page had a bounce rate of just 4.53%, proving that the traffic we drove was highly engaged and found exactly what they were looking for.
By focusing on a data-informed strategy that amplified the restaurant’s unique story and experience, we were able to build a resilient marketing engine that not only weathered industry headwinds but thrived, capturing market share and building a stronger brand. It’s proof that the right insights, paired with creative execution, are the most powerful ingredients for success.
Restaurant Trends for 2025
Research from Square earlier this year provides insights on customers
The restaurant industry is no stranger to challenges. Between rising costs, supply chain disruptions, and volatile customer demand, it's a tough time to be an operator. However, a recent report from Square, "The Future of Restaurants 2025," reveals how business owners felt earlier this year. While optimism may be waning in the current economic environment, there are nuggets of knowledge to be had from this report.
Some optimism is fueled by new opportunities in technology, customer engagement, and business strategy. For restaurant owners, navigating this landscape successfully means moving beyond gut feelings and embracing data-driven decision-making. Here at Paisley Analytics, we've analyzed the report to bring you the key findings and strategic insights to sense trends in the hospitality industry.
1. The Biggest Hurdle Isn't Staffing—It's Time
While hiring has become easier for 60% of operators over the past year, restaurant leaders are feeling a significant time crunch. Roughly three-quarters of owners reported spending more time on nearly every aspect of their business compared to a year ago.
- 75% are spending more time on business strategy.
- 75% are spending more time on management.
- 74% are spending more time on managing finances and cash flow.
- 73% are spending more time on hiring, despite it getting easier.
Strategic Takeaway: The path to reclaiming your time lies in technology. 72% of restaurant leaders are already looking into tech solutions to save time. The first step is to analyze your own operations to identify the most significant time sinks. Are you manually building staff schedules? Are you tracking inventory on a clipboard? Integrated systems, like a POS that works with payroll and scheduling software, can automate these back-of-house tasks, freeing you up to focus on growth and strategy.
2. The Great Disconnect: Value vs. Price
Restaurateurs are caught between consumer expectations and operational reality. As 63% of consumers report cutting back on restaurant spending , nearly all (98%) restaurant leaders have responded by adding or expanding value offers and discounts.
However, the pressure of rising food and wage costs is undeniable, leading 71% of operators to plan price increases in the next 12 months. This creates a delicate balancing act. An additional point of friction is fees. More than half of consumers find fees for credit card usage (59%), kitchen appreciation (53%), and minimum tip settings (52%) to be unacceptable , yet over a third of restaurants are charging them.
Strategic Takeaway: Navigating this pricing puzzle requires a scalpel, not a hammer. Instead of across-the-board price hikes, use your sales data to make surgical adjustments. You might find that customers won't mind a price increase on a top-selling signature item they already love. Analyze your margins to see where you can afford to offer combo deals or loyalty discounts. If you must implement fees, be transparent. Explaining why a charge is necessary on your menu or website can foster understanding and goodwill.
3. Loyalty and Direct Communication Drive Growth
If you want to turn a first-time visitor into a regular, a robust loyalty program is your most powerful tool. A remarkable 83% of restaurant leaders with a loyalty program say it is successful in driving increased order sizes and repeat visits.
So, what do customers want from these programs?
- Exclusive discounts (84%)
- The ability to earn rewards (83%)
- Personalization (69%)
While restaurants are using social media, there's a huge opportunity in more direct channels. For two years running, consumers have said their number one preferred communication method from businesses is email (63%), with text messages jumping significantly to become the clear number two (44%).
Strategic Takeaway: Leverage your customer data. A one-size-fits-all loyalty program is a missed opportunity. Use your POS and CRM data to create personalized offers based on a customer's order history. If a customer orders the same coffee every Tuesday, a targeted "50% off your next latte" email is far more effective than a generic blast. Ramping up your email and text marketing programs is a direct, data-backed way to drive repeat business.
4. Beyond the Core Menu: New Revenue Streams
Growth isn't just about selling more entrees. Three-quarters (76%) of restaurant leaders believe that retail or service offerings beyond made-to-order food are important to their growth plans. Consumers are on board, with 51% having purchased a retail item from a local restaurant in the past year. Furthermore, 24% of consumers are becoming regulars in this space, buying four or more retail items or services over the last 12 months.
Potential revenue from customers may include introducing prepackaged food, catering services, kitchen supplies, branded clothing, and even subscription boxes.
Strategic Takeaway: Start small and test the waters. Use your business data to identify your best-selling items—could that signature sauce or spice rub be bottled and sold? Poll your most loyal customers to see what they would be interested in purchasing. By analyzing sales and customer feedback, you can add new revenue streams without a massive upfront investment.
The Path Forward
The current economic uncertainty provides a pivotal opportunity for restaurants to evolve. Fluctuations in pricing, downward pressure, both directly and indirectly, from tariffs and a changing regulatory environment require a better sense of how the market is changing.
Success will belong to those who understand their customers, streamline their operations, and make strategic decisions based on hard data. The insights from the Square report are one example of the data available. The next step is to apply them to your own business.
At Paisley Analytics, we specialize in helping restaurants unlock the power of their data. From optimizing menu pricing and identifying time-saving automation opportunities to building data-driven loyalty campaigns, we provide the clarity you need to not only survive but thrive. Contact us today to learn how we can help you prepare for next year and beyond.